A
framework for
transit-oriented
development.
Reinventing
the Suburbs
by Keith C. Hall
July 2018
modified from Jun. 15, 2017
LinkedIn article
"Toward an Evaluation
Framework for TOD"
Part Three: Toward a Framework for Evaluating TOD
In Parts I and II, I hypothesized that the reason for Seattle's success with transit has at least a notional relationship to what the city does with land use and that areas with the greatest potential for growth in transit-oriented development (TOD) are in station areas that are already dense, rather than in station areas that have large chunks of underutilized land.
I evaluated the potential for TOD at a few key Sound Transit stations under existing zoning. Zoning changes at key transit stations could easily bring in more development (for example, Sound Transit entered into a mixed-use development lease for 400 housing units plus commercial space at its Capitol Hill station site, when my analysis under current zoning identified the potential for only 278 more units). However, the expanded proposal at Capitol Hill does reinforce a key premise articulated in the latter article: station areas with the greatest potential for more TOD are more likely to be those that are already densely developed rather than those with large areas of underutilized land.
In the evaluation of Seattle's TOD potential, I specifically focused on the 400m (quarter mile) radius as the catchment shed in part because that's a common metric for walk access (though one can easily debate whether that is really true) and in part because it resulted in a more reasonable set of properties that could be evaluated in some level of detail. In this article, I will look at a broader area but continue to use 400m as the basis for data evaluation (due to data availability). In both of the previous articles, I touched on the relationship between parking and the form that development takes. In neither article did I really attempt to articulate what TOD should be, and that is what I plan to do here.
What is TOD?
Is TOD an old mixed-use town center that once served as a streetcar hub? American cities are full of those, including the Seattle examples that identified as the best candidates for future TOD. Or is TOD just what has been built more recently at new transit stations? Places like Mockingbird Station in Dallas, Lindbergh Station in Atlanta, or Cascade Station in Portland, along with numerous examples in the Washington, D.C. area. Of course, I'd argue that the best example of American TOD is Manhattan (as well as large swaths of Queens, Brooklyn, the Bronx, and parts of New Jersey).
If urban NYC is really our best example of TOD, then I must necessarily conclude that "Transit-Oriented Development" is, perhaps, nothing more than a cute term to illustrate how little we're really willing to accomplish in the evolution and development of modern cities. In short, we've thrown all of our urban "smart growth" hopes onto tiny little circles encompassed within vast regions of auto-oriented suburbia, thereby protecting a really awful status quo across most of our sprawling landscapes while hoping these little bubbles of higher density will make up for the damage that NIMBY-oriented zoning does across the majority of our regional landscapes. And what's most remarkable is that we're still doing this as we approach the post-privately-owned-automobile ("mobility as a service") era.
As much as I'd like to think this should be a framework for building walkable urban cities (at least throughout our central city areas), we have to settle for the little blips on transit network maps that we call TODs. In the end, I'm not really trying to solve our society's unwillingness to let cities evolve; I'm just trying to identify a baseline metric for evaluating TOD.
TOD Principles
Based on my past work, the short summary of my "way of thinking" is founded on a few simple principles:
- Trips are represented by population (trip origins), employment (a range of trip destinations that can vary by time of day and purpose, including both workers and visitors), and education (non-work trip destinations that that have their own unique trip-making characteristics). I often leave education out because the trips are difficult to identify and connect to the academic student population with any degree of accuracy.
- Station areas that are more dense represent a larger potential market with easier walk access to transit, both for trip origins and trip destinations, than stations with lower densities. Parking and street infrastructure are key considerations because they both consume land without adding population, employment, or education uses AND because they complement a competing mode, thereby diminishing the effectiveness of transit and TOD. However, a well-developed street network is fundamental to providing pedestrian access throughout a TOD area, even for those trips that never use transit (people in dense, mixed-use areas area also more likely to walk and bike, even if they never use transit).
- The greater the mix of uses, the more likely that trips will be distributed across both times of day and directions of travel on the transit system. In other words, mixing residential, office, education, retail, and institutional uses, and at higher densities, at transit stations will result in more trip spreading than at single-use nodes (e.g. a high density residential area will produce most of its trips in an 8-5 commute pattern in much the same way, but in opposite directions of, a high density office district). In contrast, larger mixed-use TODs, like Manhattan, produce transit and walking trips at all times of day and night (though some subareas dominated by office-only uses, like the Financial District, tend to be fairly dead at non-peak times).
- These characteristics have less to do with TOD than how global cities typically evolved before we began stifling their evolution through economic and policy interventions (investing in highways and regulating use and density through zoning). But, again, I'm limiting this discussion to the first 400m outside a transit station because, if we can't create real cities in our cities, we may as well try to create real cities for the first quarter mile outside of a transit stop. Indeed, I am a bit cynical.
A Proposed TOD Evaluation Framework
My ideal version of a TOD will push the boundaries, and this framework is designed to do that. If we think of our current infrastructure standards and zoning requirements as a set of dishes in the cupboard, then we need to take them out and smash them on the floor. Adding new infrastructure guidelines and zoning overlays to accomplish TOD won't effectively solve the problems with our underlying standards and requirements.
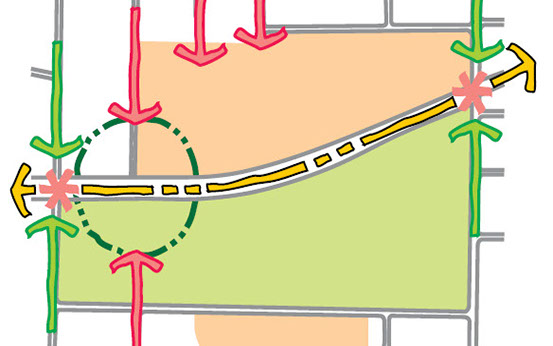
This proposed framework is largely focused around rail stations as bubbles of density in a sprawling regional suburban landscape, but the concept here could easily be applied to frequent bus and streetcar corridors.
Growth
The first component of my proposed TOD Evaluation Framework involves growth simply because change involves new development, and increased density relies on growth to occur within the TOD. Table 1 illustrates how a TOD might contemplate growth as part of a broader subarea or neighbourhood plan.
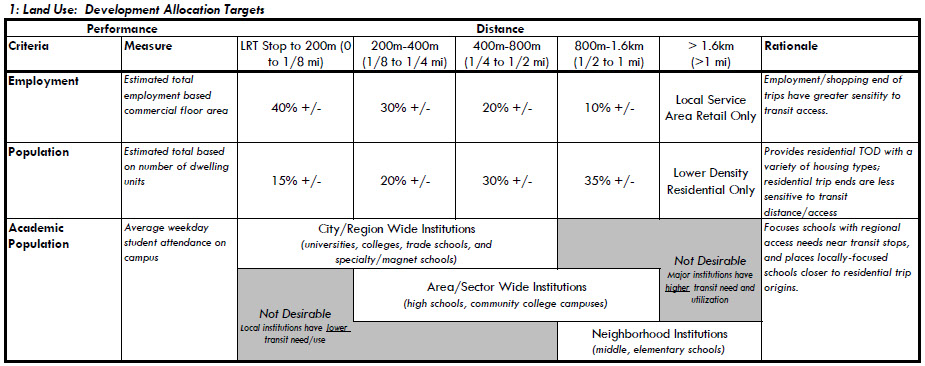
The targets illustrated in Table 1 can be debated, but they are based on the basic principle that growth most closely associated with transit should focused around the station. Since employment destinations are more sensitive to proximity to transit than residential uses, they should be closer to the transit stop. That basically means I have pushed more employment in the inner 200m ring than in the outer rings, while I have balanced population across the various rings. Given that the land area in each ring increases moving outward from the transit stop, a nice link could be made to form-based zoning codes. Likewise, schools serving neighbourhoodds should generally be in the neighbourhoodds they serve, while city-wide or regional academic institutions should be closer to the transit stop.
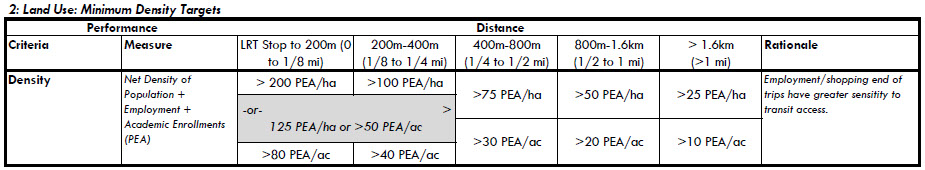
Density
I lean toward measuring density as the sum of population, employment, and education (PEA, changing "education" to "academic" to avoid the less desirable acronym of PEE). Table 2 illustrates a potential set of minimum net density targets for the "urban" TOD rings around stations. This combined density is deliberately linked to the growth allocations identified in Table 1; the challenge is developing a framework plan to accommodate the right balance of housing, retail, office, and academic uses within each of these rings around a station. One thing to note: net density is the density measure for buildable area, but I have applied the factors to gross density, so keep that distinction in mind (it needs more work).
Streets and Parking
The final piece of the framework is the part that's most challenging to achieve because it's where I've really pushed the boundaries. In Table 3, I've proposed a maximum land area devoted to transportation uses in each ring in combination with a minimum network connectivity and street density measure (a few of these measures are loosely based on the LEED-ND approach). As with Growth and Density targets, the Streets and Parking measures create a tension between maximizing access with more streets and the desire to minimize the amount of street infrastructure we put in place.
The one key difference with Growth and Density is that the Streets and Parking element of the proposed framework may only be applicable in greenfield TODs. Where street networks already exist, there may be little opportunity to influence a change (maybe we could convert a few car streets into something else, though).
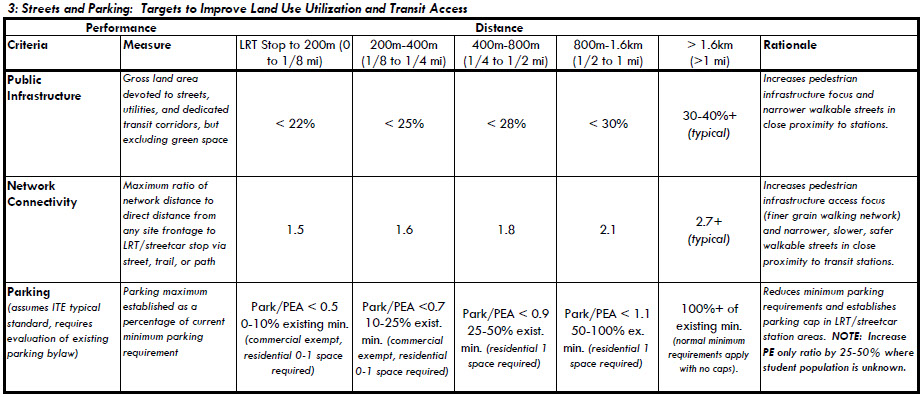
The premise here is that American cities devote a ridiculous amount of land area to transportation. Our current approach and standards for infrastructure make the target for the innermost 200m area around the transit station nearly (if not absolutely) impossible to achieve. At at least one of the Seattle area TOD examples, it appears that public infrastructure may account for as little as 16% of the total land area within the 400m station radii, but most station areas have far more land devoted to streets.
Station areas on the well-connected urban grid, like Alaska Junction, Capitol Hill and Graham, appear to have around 35% of land area devoted to street infrastructure and surface parking. To achieve both access and street coverage goals, the proposal in Table 3 will challenge a designer to incorporate pedestrian and cycle "streets" as primary transportation routes and as the sole means of access to some lot frontages. There are a few houses in Seattle whose front doors have access only to a set of public stairs or a sidewalk, and this proposed approach would encourage more of that kind of design around stations. It is likely that most American cities will never reach the targets proposed in Table 3 (perhaps I should be evaluating Dutch TODs).
It should go without saying that I've incorporated maximum parking requirements in Table 3, and this includes eliminating park-and-ride from TOD areas. The park-and-ride lot can be at another station somewhere else (e.g. in a low density neighbourhood of NIMBYs who will resist any changes to zoning).
Applying the Proposed Framework to Seattle TODs
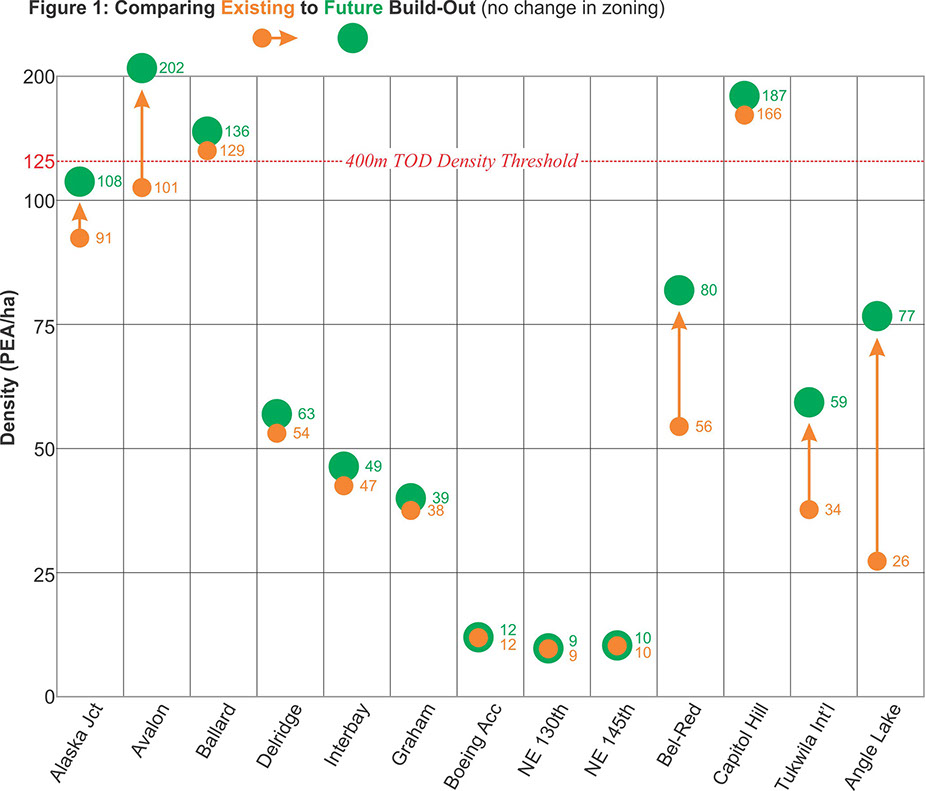
In a TOD planning framework where the inner 200m circle should have a minimum density of 200 PEA/ha and the 200m-400m ring should have a minimum density of 100 PEA/ha, then the overall quarter mile area around a station should have a minimum density of 125 PEA/ha as the minimum density target. How do Seattle area stations compare?
Alaska Junction
Growth: Alaska Junction has seen a significant amount of mixed-use redevelopment. It is approximately 70% residential within the 400m station area, meeting my proposed definition of mixed-use. Employment is largely retail, and most jobs (and growth) are located on the two streets that directly connect to the likely location of the future transit station, as well as the existing bus transfer hub.
Density: The existing density is 91 PE/ha (there are no major academic institutions), and the build-out density under current zoning is estimated to be 108 PE/ha. A minor zoning modification involving a single major development or several minor developments could allow Alaska Junction to meet its 125 PE/ha density target.
Streets and Parking: Since the street network already exists, this station cannot meet the street coverage targets outlined in Table 3; however, it likely meets the access targets. There is probably a great deal more parking than the proposed in Table 3 recommend, but this area is undergoing a redevelopment transformation under Seattle's relatively tight parking caps.
Avalon
Growth: Avalon has seen a significant amount of higher density residential. It is approximately 81% residential within the 400m station area, meeting my proposed definition of a single-use area. Redevelopment of low-density commercial uses to higher density-mixed use development may alter the ratio of residential to non-residential.
Density: The existing density is 101 PE/ha (there are no major academic institutions), and the build-out density under current zoning is estimated to be 202 PE/ha, far exceeding the potential density target for a TOD.
Streets and Parking: Since the street network already exists, this station cannot meet the street coverage targets outlined in Table 3; however, it likely meets the access targets. There is as substantial amount of surface parking at low-density retail establishments, but the higher density residential areas have been built with as few as one parking space for every 4-5 units (a couple 7-story of micro-unit buildings have no parking at all).
Ballard
Growth: Ballard has also seen a significant amount of higher density mixed-use development. It is approximately 65% residential within the 400m station area and well within my proposed definition of a mixed-use area.
Density: The existing density is 129 PE/ha (there are no major academic institutions), and the build-out density under current zoning is estimated to be 136 PE/ha, exceeding the potential density target for a TOD even today.
Streets and Parking: Since the street network already exists, this station cannot meet the street coverage targets outlined in Table 3; however, it likely meets the access targets. This station has larger percentage of its land area devoted to transportation, as compared to Alaska Junction, Avalon, and Capitol Hill (perhaps due to a wider Market Street and 15th Ave at the center of the TOD). There is as substantial amount of surface parking in a few remaining commercial and industrial uses, and the higher density residential areas have been built with as few as one parking space for every 4-5 units.
Capitol Hill
Growth: Capitol Hill has long been one of Seattle's higher density neighbourhoodds. It is approximately 68% residential within the 400m station area and well within my proposed definition of a mixed-use area.
Density: The existing density is 166 PE/ha, and the build-out density under current zoning is estimated to be 187 PE/ha, exceeding the potential density target for a TOD even today (the density is adjusted for the joint development that has been approved for Capitol Hill station, so the data here differ slightly from those shown in the related article). One thing to note is that there is a large community college near the station, and this likely pushes the actual "PEA" density to a much higher level (the challenge in counting enrollments in the PEA factor include determining how many students to count when only part of the college is within the 400m radius, identifying the ratio of full-time to part-time students and how many average daily trips are made, and eliminating distance learning students from the total count).
Streets and Parking: Since the street network already exists, this station cannot meet the street coverage targets outlined in Table 3; however, it likely meets the access targets. Many of the older walk-up apartments in the area have little or no parking at all, and this area has the lowest parking ratio of any of the Seattle stations evaluated.
Other Stations
The other 9 of the 13 stations evaluated do not appear to have the potential to reach a minimum density appropriate to be considered TOD, as illustrated in Figure 1 below.
Even as blips on a big regional map, Seattle's regional rail system has relatively few TODs among many with little land use change and others where land use change is not sufficient to reach a desired level of TOD density. However, a targeted planning effort (and perhaps some public dollars) could expand the TOD potential at stations with large tracts of underutilized land. In the end, rapidly-growing Seattle has little land on which to grow, and there may ultimately be a market for urban development between the end of an airport runway and a federal prison. There may even be an opportunity to test the Table 3 transportation metrics as part of an entirely new urban infrastructure design standard (Issaquah Highlands created one, so there is a precedent for doing something quite different in the region).
It takes a walkable city to make a transit city.
And that takes me to my final conclusion. Planning little bubbles along our rail lines is helpful, but it won't get us far in planning for transit-oriented cities. As my final number crunching exercise, I took a look at Atlanta and Toronto. Why? Both cities (not regions) have 4 rapid transit lines with streetcar and bus service. Atlanta's planned streetcar system (86 kilometres / 52 miles) is the same size as Toronto's existing system. Of course, you must recognize that there is a fundamental difference between the two cities in population and size, and that other regional transit systems affect Toronto to a much greater extent than Atlanta. However, the fundamental makeup of the two cities is different in significant ways that affect transit, but they are not so different that Atlanta couldn't approach Toronto's outcomes with good urban land use planning and the planned level of transit investments (but it will be significantly affected by Atlanta's addiction to freeway-building).
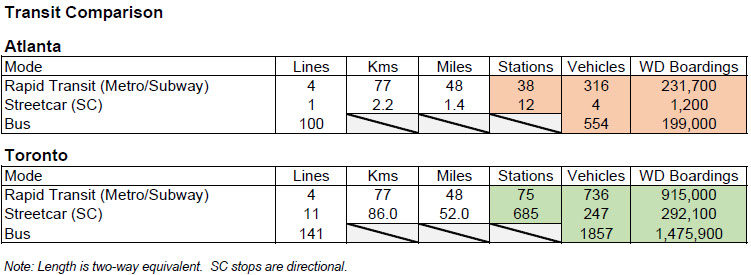
The table above shows that Atlanta and Toronto have similar investments in rapid transit, but despite the similar scale, Toronto has more stations (more access) and more cars (more frequency of service). Stated another way, for the same length of subway/metro, Toronto has twice the access, twice the service, and four times the ridership as Atlanta. The difference in bus service is even more pronounced; Toronto has three times the number of buses but seven times as many bus riders as Atlanta. Why?
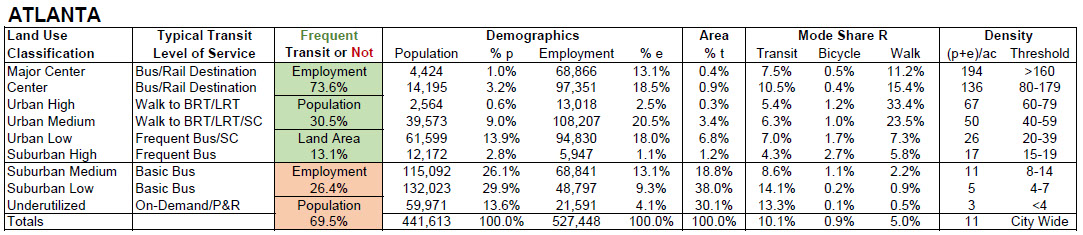
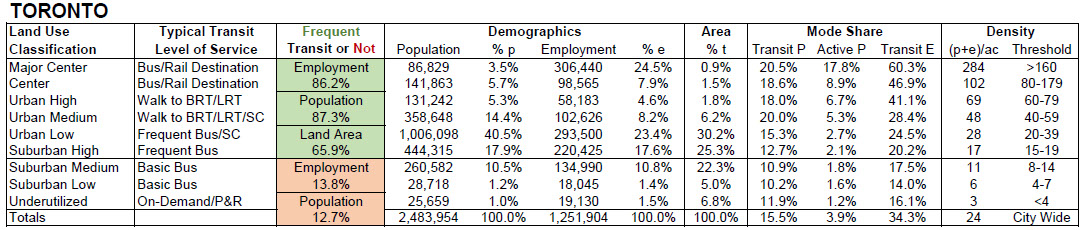
The difference is urban form and density, coupled with differences in street network connectivity. The tables above and below only look at the difference in density (residential + employment) and mode share at the census tract level. The differences are obvious:
- In Atlanta, 74% of employment, 31% of population, and 13% of the city's land area are in census tracts with sufficent density to support frequent bus service. That is, nearly 70% of Atlanta residents do not live in areas viable for quality bus service.
- In Toronto, 86% of employment and 87% of population are in areas where frequent bus service is feasible.
- Scale is important, particularly for the downtown areas where the highest level of transit service exists. Nearly 32% of the employment base is in its urban core in both cities, but the 396,000 urban centre workers in Toronto, as compared to Atlanta's 165,000, represent a signficantly larger transit market.
- Atlanta has relatively high walk mode share in its urban neighbourhoods, but that doesn't appear to translate into higher transit ridership to the same extent that it does in Toronto.
- Another intersesting note on Toronto is the clearer relationship between density and transit ridership for work destination trips (similar data were not readily available for Atlanta). The relationship between density and transit use at the destination is clearly much more linear than for the residential end of the trip. However, Toronto shows that there is a similarly linear relationship between active transportation and residential density for the origin end of the trip (the relationship is less clear in Atlanta, where walkable neighbourhoods are clustered in high density areas and less so in the urban centres).
Conclusions
Density matters for both transit and active modes. So does scale.
Dense, mixed-use TOD may not perform if it exists as isolated islands at suburban rail stations.
American cities need to undertake dramatic transformations in their central cities to lure both employers and residents if we want to develop walkable, transit-oriented development.
And maybe we need to cut out or parking and freeway building habits.
a publication of